
How we read the numbers
How payroll cost is rebuilt from payments, and how it is checked against three State documents.
The Cassetto Fiscale, the company’s tax drawer at the Agenzia delle Entrate (the Italian Revenue Agency), holds no payslips. It holds the contributions paid each month, the employees’ annual income statements and the employer’s withholding tax return. FiscalPulse starts from these three documents, prints the formula it uses and says how far the resulting figure goes.
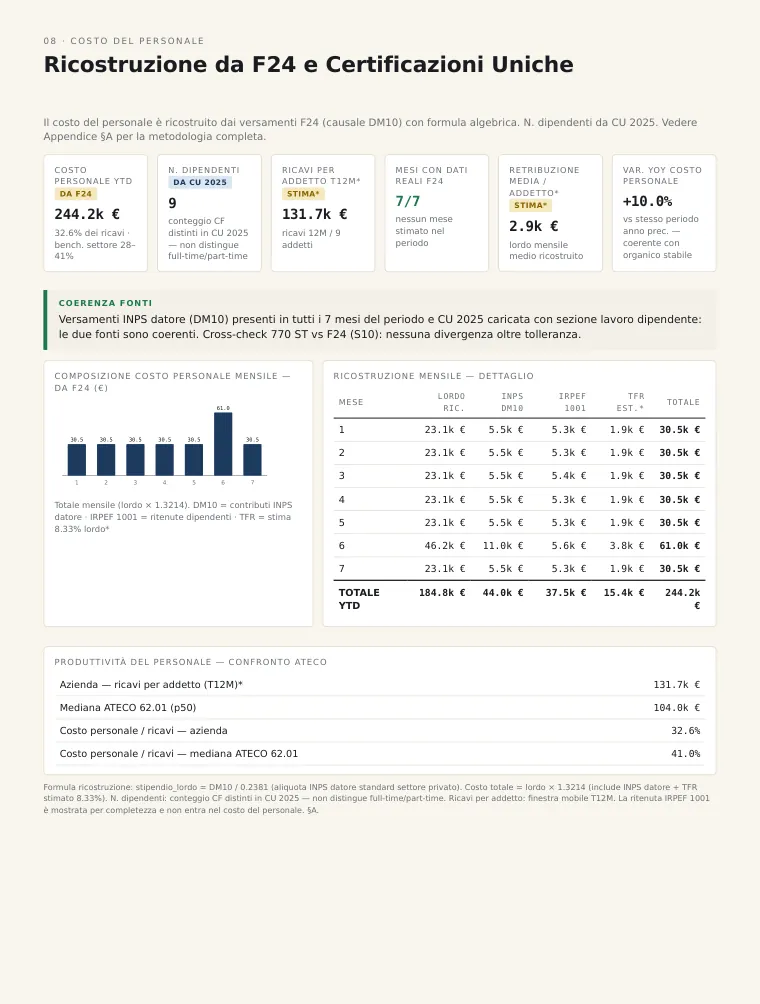
Payroll cost YTD from F24 €244.2k, 9 employees from CU 2025, source consistency
Sample company · illustrative data
The first source: contributions paid each month
Every month the company pays the employer’s INPS social security contributions through the F24, the single form for Italian taxes and contributions, under the DM10 reason code (the employer’s monthly contribution filing). From that amount, using the standard private-sector contribution rate, the report works back to the month’s total gross pay. It then adds the contributions themselves and an estimate of TFR, the Italian severance pay that accrues each year, at 8.33% of gross pay, and arrives at total cost.
Read more
In the sample company, DM10 contributions are €5,500 a month: rebuilt gross pay is about €23,100 and total cost about €30,500. In June, with the extra month’s pay, contributions double and the month’s cost rises to €61,000. Over the first seven months the total is €244,200, 32.6% of revenue.
Monthly reconstruction, breakdown of gross pay, INPS DM10, estimated TFR, total
Sample company · illustrative data
DM10 contributions €5,500 a month · rebuilt gross pay €23,100 · total cost €30,500 · June €61,000 · seven-month total €244,200, 7 months out of 7 with actual payments
The second source: the Certificazioni Uniche
The Certificazioni Uniche (CU, the annual income statements the employer issues to each employee) show who worked for the company during the year. The report counts the distinct tax codes of employees and arrives at headcount: in the example, nine people. From there it works out revenue per employee, €131,700 over twelve months, and compares it with the median for companies in the same sector, €104,000.
Read more
The count does not distinguish full-time from part-time, and the report says so next to the figure.
Number of employees from CU 2025
Staff productivity, ATECO comparison
Sample company · illustrative data
Employees from CU 2025: 9 · revenue per employee €131.7k (estimate) · sector median €104.0k
The third source: the Modello 770
The Modello 770 is the annual return in which the company, acting as withholding agent, summarises the tax withheld from pay and paid over, month by month. The report compares it with the F24 payments and flags any gap between withholding declared and withholding paid beyond the tolerance.
Read more
The same comparison brings out tax withheld and certified in a CU but not yet paid over, before an Agenzia letter does. In the example, contributions show as paid in all seven months, the CU is loaded with its employment income section, and the comparison between the 770 and the F24 payments finds no gap.
Sample company · illustrative data
Source consistency · DM10 present in 7 months out of 7 · CU 2025 with employment income section · 770 against F24: no gap beyond tolerance
What the figure says, and how far it goes
The payroll cost that comes out of these three documents is a company-wide figure, rebuilt from actual payments. No month is estimated and two independent sources confirm it. On the report’s certainty scale it sits one step above an estimate and one step below a measured figure, one read directly from a document.
Read more
The report does not know any individual’s salary and does not show it. Average pay per employee, about €2,900 gross a month in the example, is marked as an estimate. TFR is estimated at 8.33% of gross pay, and IRPEF (personal income tax) withholding appears for completeness but stays out of the cost. The comparison with companies in the same sector, where staff account for between 28% and 41% of revenue, gives a second yardstick for judging whether the figure is plausible.
Sample company · illustrative data
Average pay per employee €2.9k gross a month (estimate) · payroll cost as a share of revenue 32.6% · sector median 41.0%
On the report page
The payroll page, with the formula printed at the bottom
The page opens with six figures: payroll cost from F24, employees from CU, revenue per employee, months with actual data, average pay and change on the previous year, each with its tag.
Read more
Below them come the “Source consistency” panel, the month-by-month reconstruction and, at the bottom, the full formula, so anyone can redo the sum.
Three State documents, one figure. If they do not agree, we tell you.
Sample company · illustrative data
Questions
How is payroll cost worked out from F24 payments?
From the INPS contributions paid under the DM10 code, the report works back to gross pay using the standard private-sector contribution rate. It then adds the contributions and an estimate of TFR, the severance pay accrual, at 8.33%. The report applies this formula month by month and prints it on the page.
Does the report know individual employees’ salaries?
No. It reads company-wide amounts: contributions paid through F24, the number of employees from the Certificazioni Uniche, and withholding declared in the Modello 770. Average pay per employee is a rebuilt average marked as an estimate, and the employee count does not distinguish full-time from part-time.
What happens if the CU, the 770 and the F24 payments do not agree?
The report flags it in the “Source consistency” panel, showing which document differs and by how much. It is the quickest way to notice tax withheld and certified but not paid over, or a missing month of contributions, before a letter from the Agenzia arrives.
Why does payroll cost double in June?
Because of the quattordicesima, an extra summer month’s pay under some national collective agreements. In the example it falls in June and lifts that month’s contributions too. In December the tredicesima, the thirteenth-month salary, has the same effect. The report reads the increase in the F24 payments and explains it as payroll seasonality on the investment capacity page.
How is the number of employees counted?
By counting the distinct tax codes of employees in the year’s Certificazioni Uniche. The number is used to work out revenue per employee and average pay. Next to the figure the report notes that the count does not distinguish full-time from part-time, so the sector comparison is read the right way.
If you would like to see your company’s payroll cost rebuilt and checked this way, the report starts with its Cassetto Fiscale credentials.