
Sample report
Before you start, browse the report you would receive every month.
Two sample companies with illustrative data, and the same report FiscalPulse builds every month from an Italian company’s Cassetto Fiscale, its tax drawer at the Agenzia delle Entrate: seventeen pages, from the cover to the methodology appendix. Below is a guided tour, page by page.
Sample company · illustrative data
The sample report, as it arrives every month
Here is the full report
We have also emailed you a link to reopen it whenever you like.
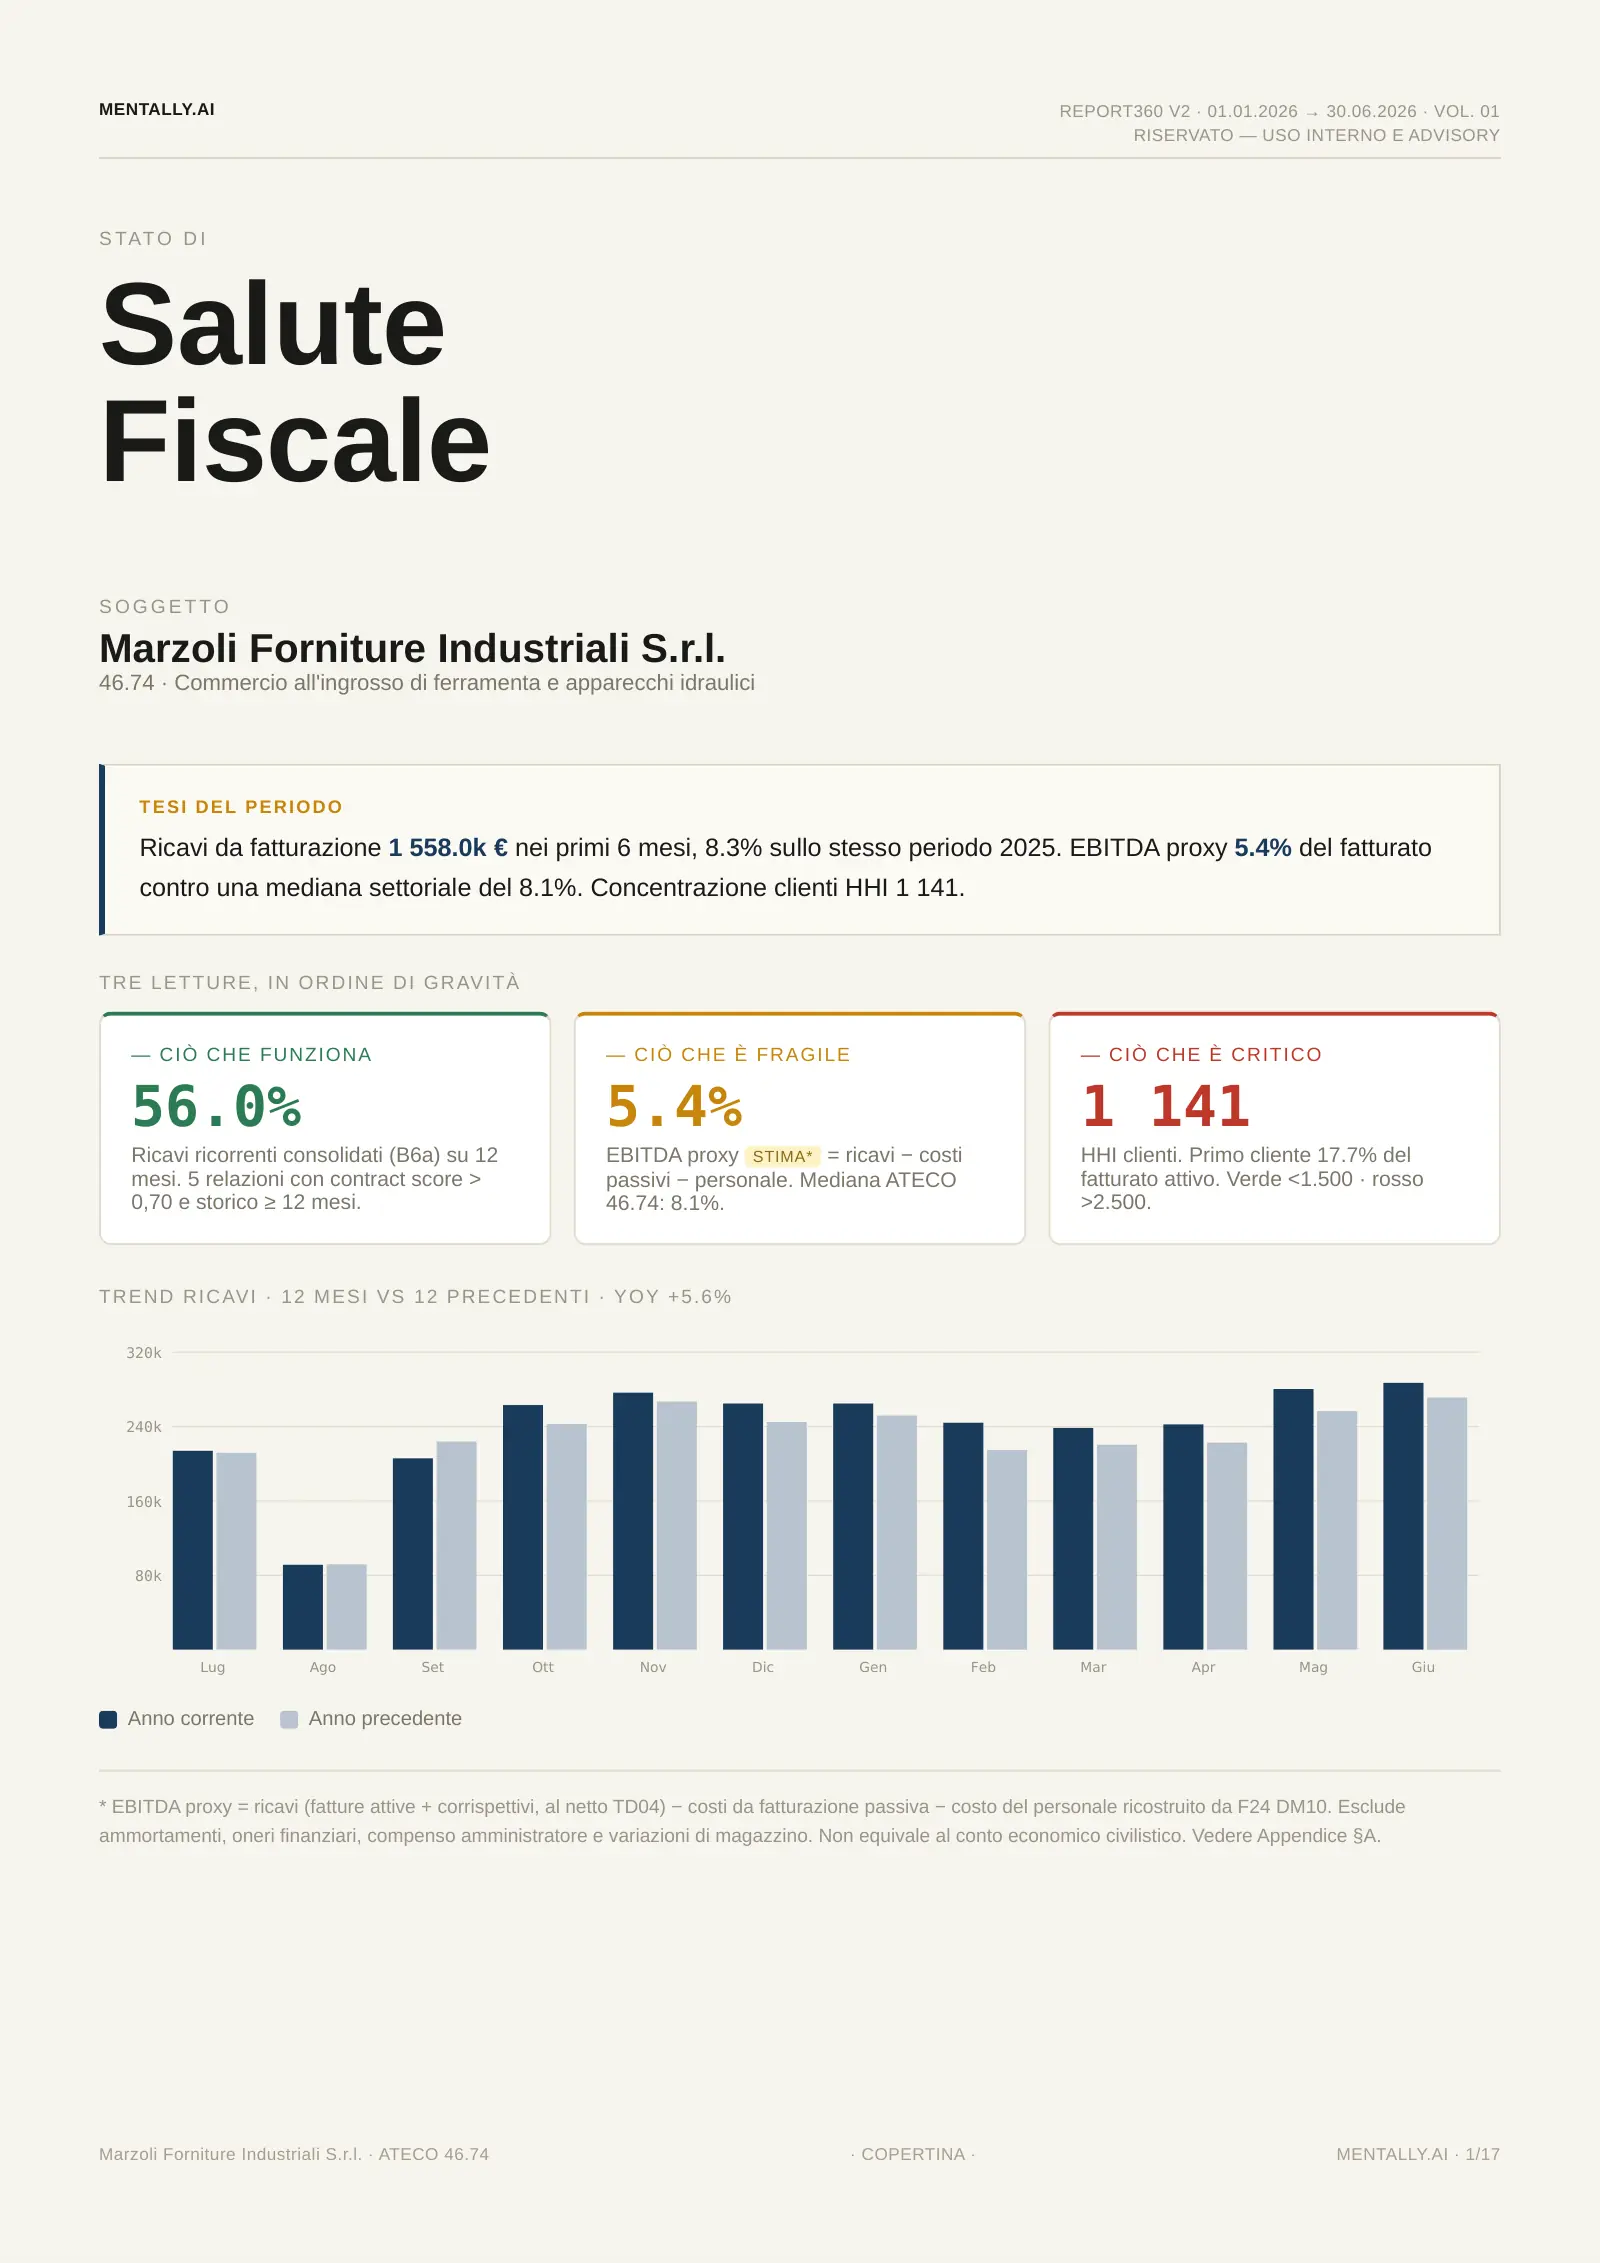
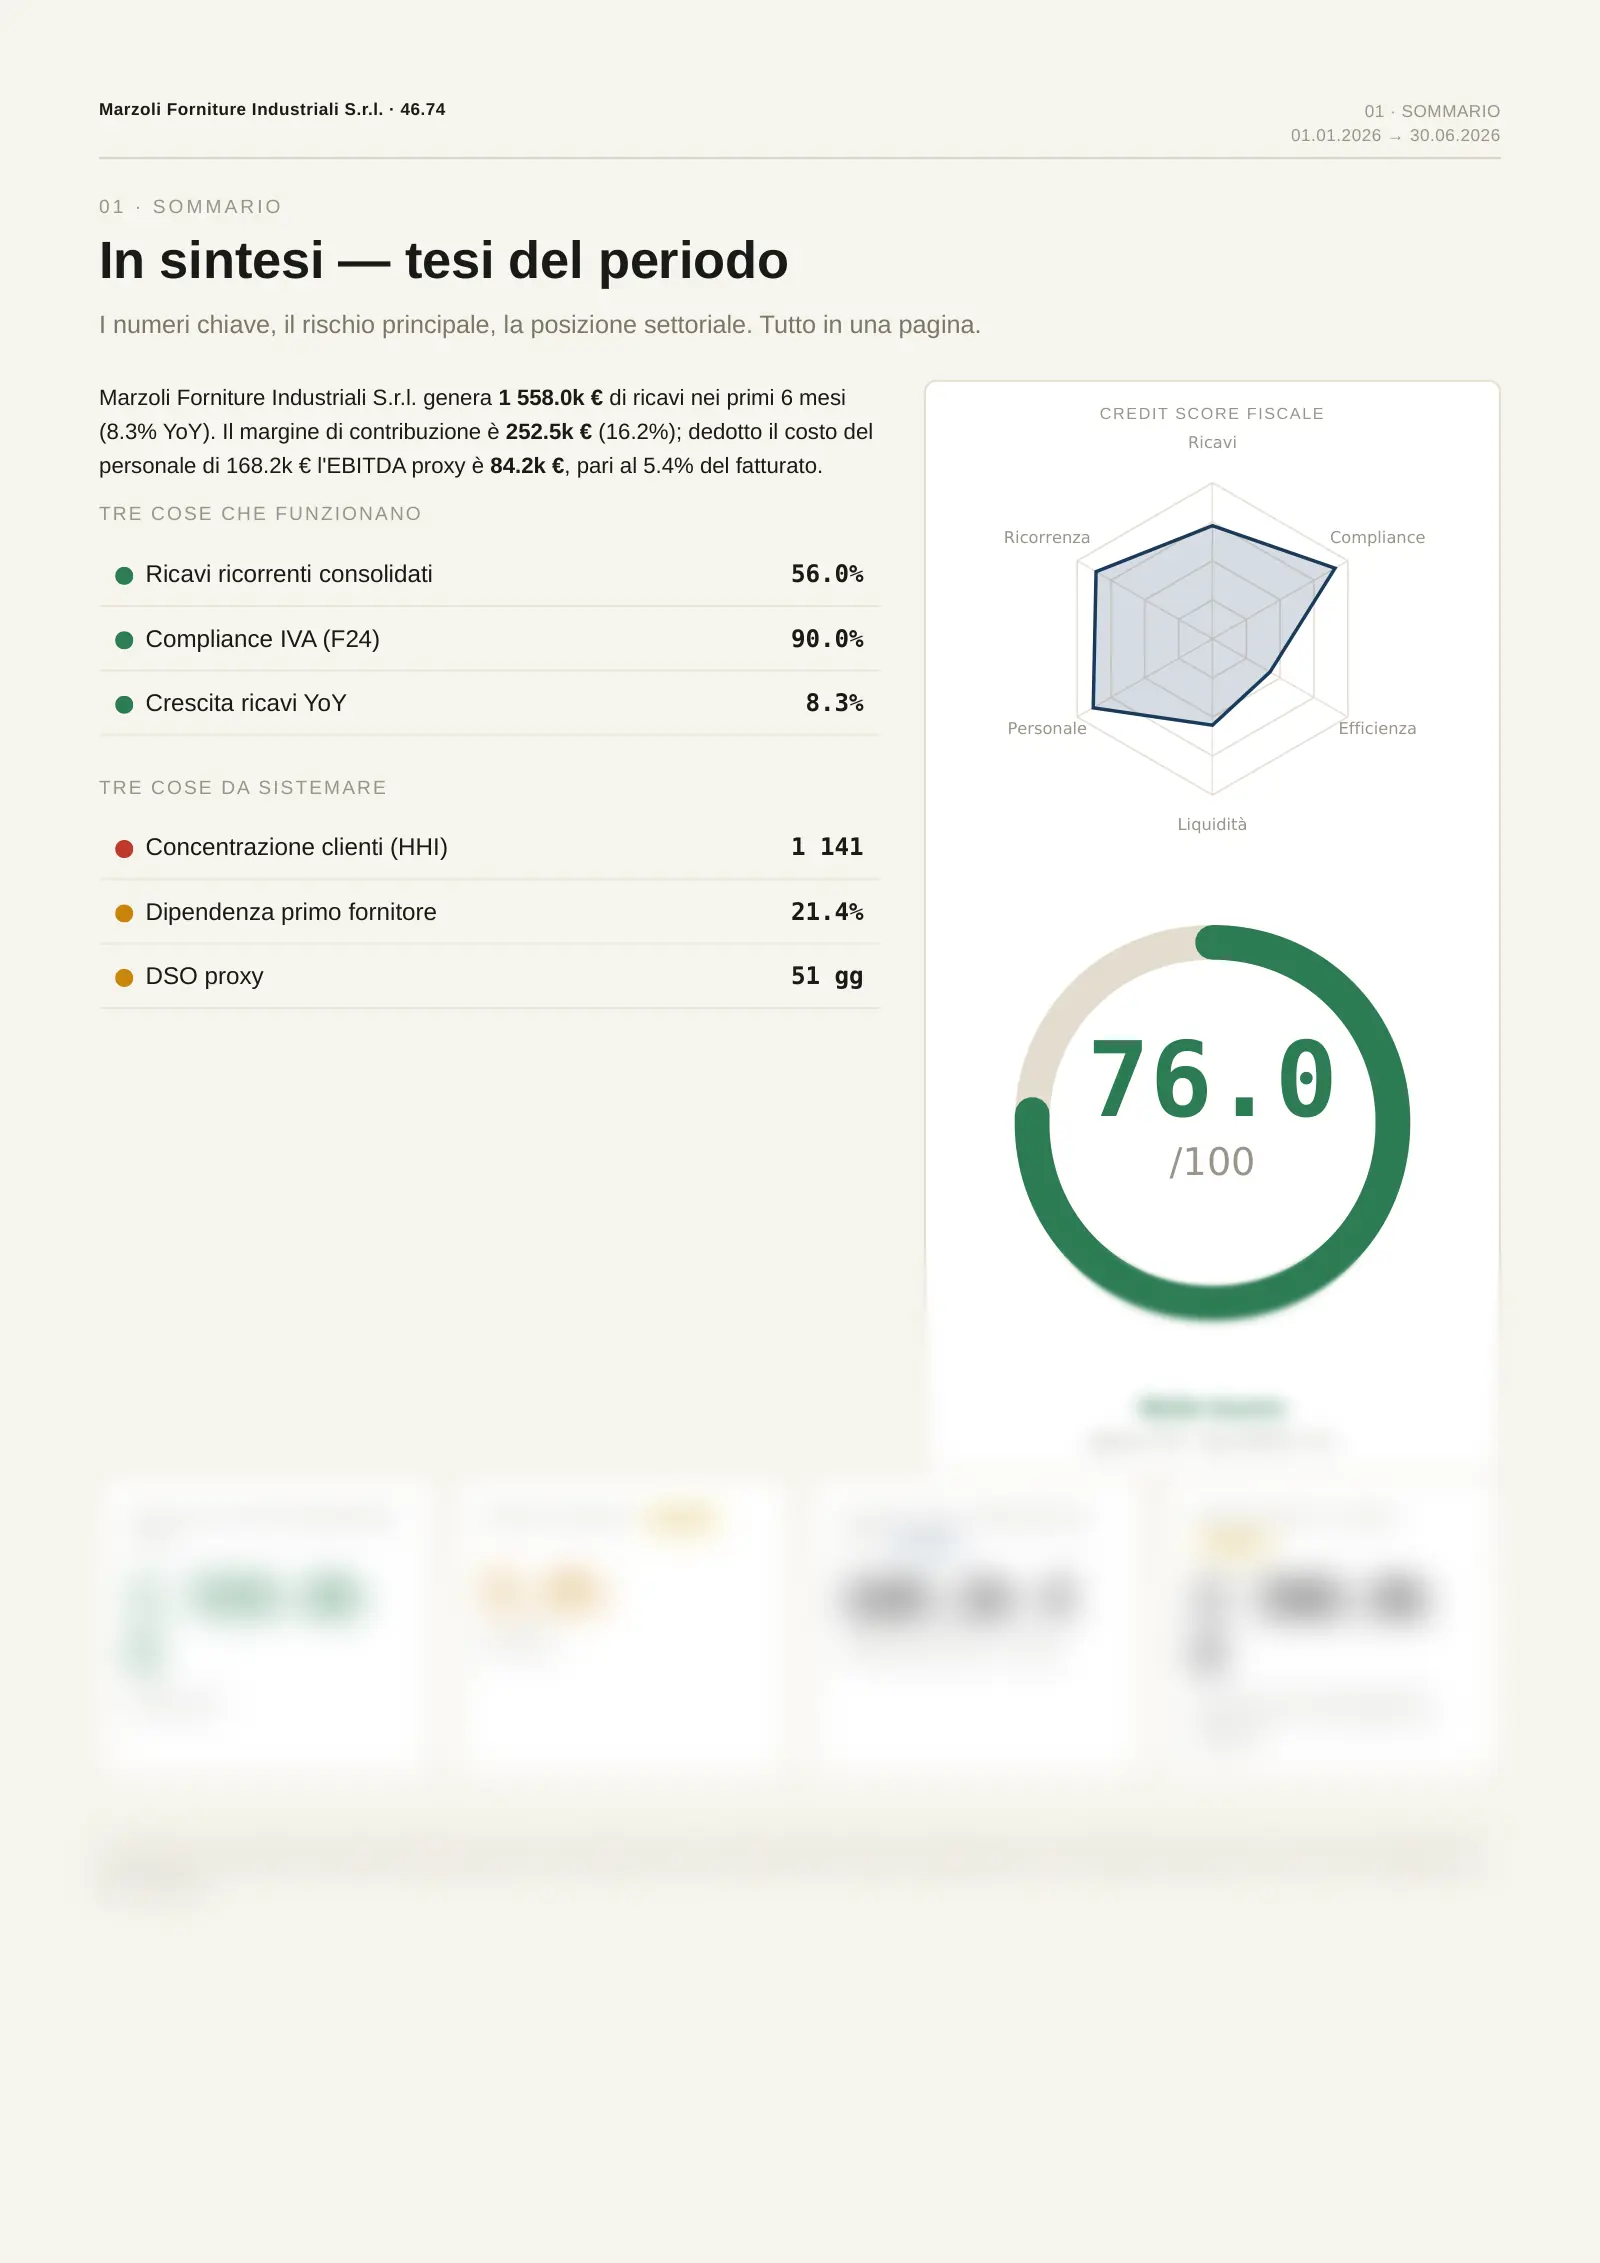
The summary goes on: three things that work, three to watch, and this month's cash.

From here on come the numbers that matter: customers, credits, letters, VAT.
What the next 14 pages show
14 more pages to read. Two minutes.
01Digital company.
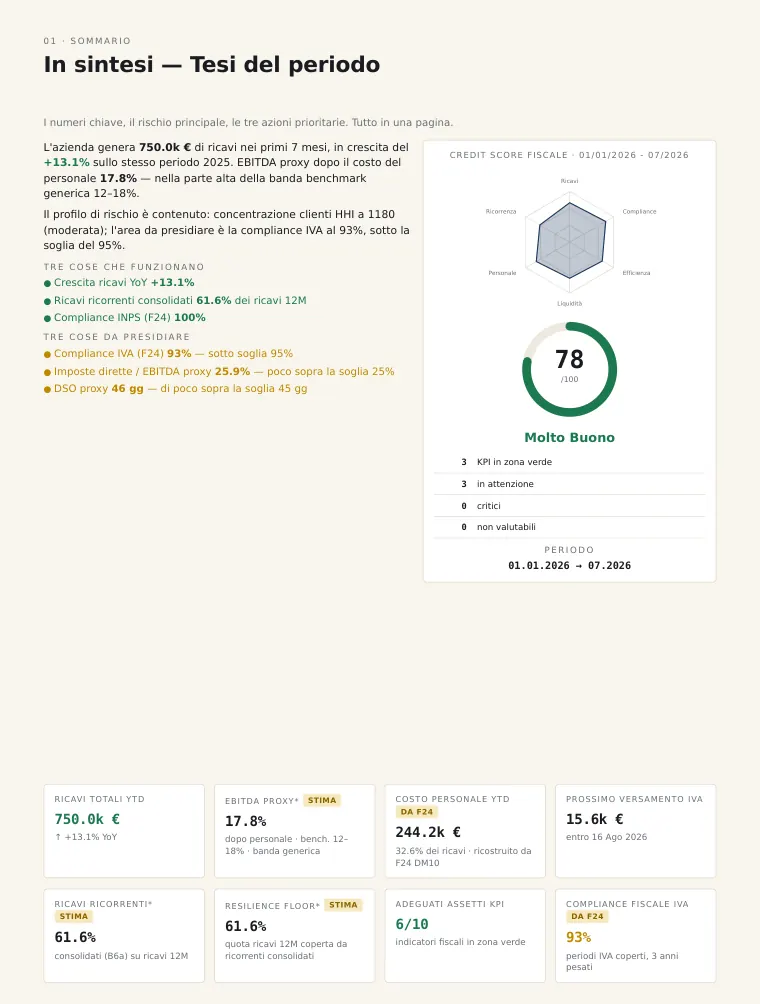
A software house with seven months of data: growing revenue, one letter from the Agenzia to settle, many recurring customers and a tax score of 78 out of 100. This is the report in the guided tour below.
02Distribution company.
A business that buys and resells goods, with thinner margins and suppliers that weigh heavily on spending. Same structure, with the numbers of a different sector.
Sample company · illustrative data. The companies, customers and suppliers in both reports are fictional.
Guided tour
Seventeen pages, and what each one tells you
The report in this tour belongs to Aurelia Digitale S.r.l., a fictional Italian software house, for January to July 2026. For each page you see what it shows and why it matters to whoever runs or oversees the company.
Sample company · illustrative data
01Page 1 · Cover
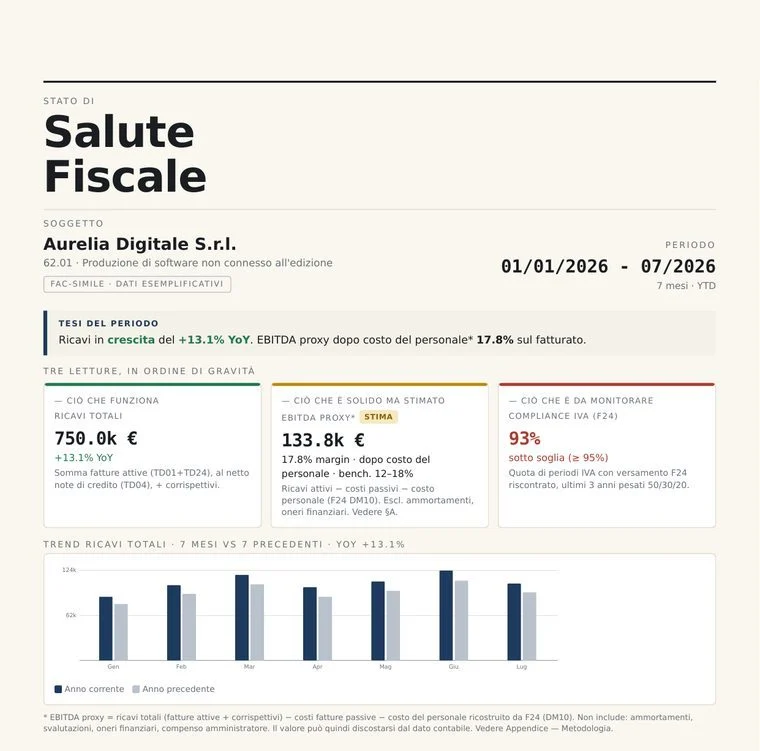
What it shows: the period’s main finding in one line and three readings in order of importance: revenue of €750.0k, up 13.1% on the year before, an estimated margin after staff costs of €133.8k, and VAT payments made on time. Below, revenue month by month against the previous year. Why it matters: in ten seconds you know how the year is going.
Sample company · illustrative data
02Page 2 · Summary
What it shows: the period in plain words, three things that work and three to watch, the tax score of 78 out of 100 and the key figures, such as the next VAT payment of €15.6k due by 16 August and staff costs of €244.2k read from the F24 payments (the form used for Italian taxes and contributions). Why it matters: it is the page to read before a meeting, or to forward to a partner or to headquarters.
Ricavi da fatturazione — 12 mesi vs 12 precedenti
Sample company · illustrative data
03Page 3 · Revenue trend
What it shows: revenue for the last twelve months against the twelve before, €1,185.0k and up 13.4%, the split by document type, customer categories by ATECO activity code (the Italian equivalent of NACE) and purchases from abroad, €120.0k year to date. Why it matters: you see real revenue month by month without waiting for the financial statements.
Struttura operativa — YTD / LYTD / ultimi 12 mesi
Sample company · illustrative data
04Page 4 · Revenue, costs and margins
What it shows: revenue, invoiced costs, staff costs and estimated margin compared with the year before and over the last twelve months, with a margin of 17.8%, plus the five largest cost categories. Why it matters: you know what the business earns and where the money goes.
Sample company · illustrative data
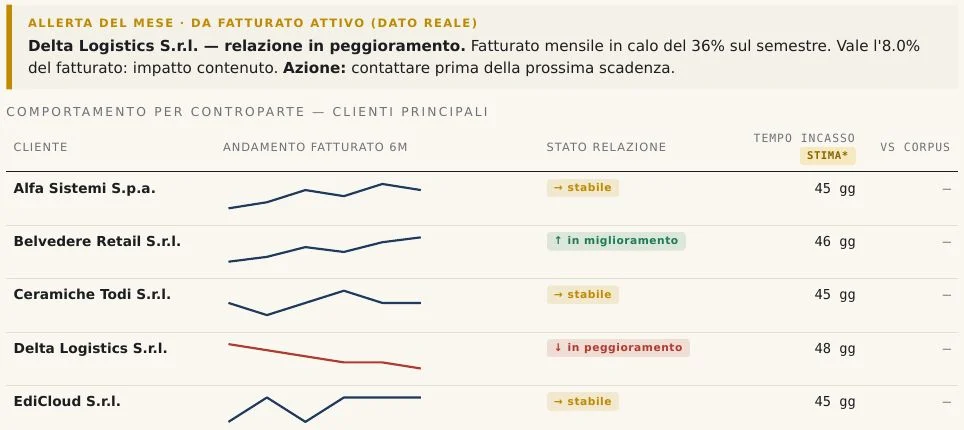
06Page 6 · Customers slowing down
What it shows: the month’s alert on a customer whose purchases fell 36% over six months and who accounts for 8% of revenue, and the state of the relationship with the main customers, with estimated collection times. Why it matters: there is still time to call them before they leave.
Benchmark ATECO 62.01 · peer 6-digit
Sample company · illustrative data
07Page 7 · Comparison with the sector
What it shows: margin, VAT compliance, customer concentration, recurring revenue, growth and productivity compared with 57 Italian companies with the same ATECO code, as percentiles. In the sample, no measure falls below the sector median. Why it matters: you see where the company is stronger than its Italian peers and where to look more closely.
Costi fornitori — quota di spesa per categoria
Sample company · illustrative data
08Page 8 · Costs by supplier category
What it shows: the share of spending by supplier category, with cloud services at 34.4% of €372,000, always by category and never judging an individual supplier. Why it matters: it shows where spending is concentrated and which contracts to review first.
Sample company · illustrative data
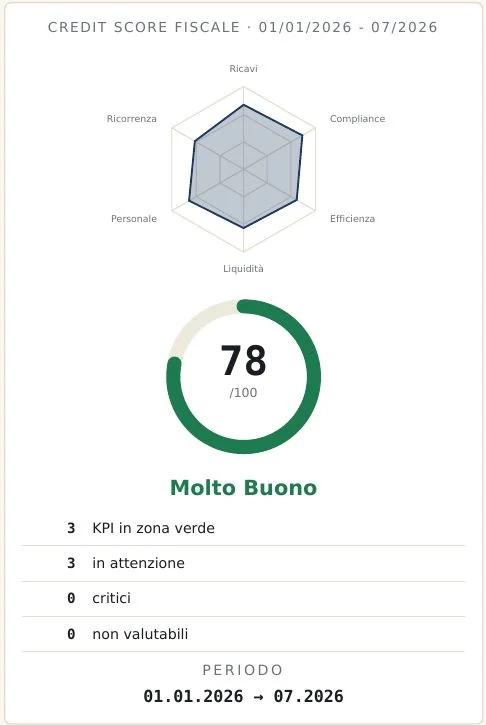
10Page 10 · Tax score
What it shows: a score of 78 out of 100, Very good, built on six dimensions with published weights, alongside the ISA index of 8.2 (the Agenzia’s own tax reliability score) and the VIES status of the VAT number. Why it matters: you know the score a lender would read before you sit down at the table. footnote: The fiscal credit score is a complementary tool based on declared tax data. It is not a regulated credit rating within the meaning of Regulation (EC) No 1060/2009.
Ricostruzione da F24 e Certificazioni Uniche
Sample company · illustrative data
11Page 11 · Staff costs
What it shows: €244.2k year to date, rebuilt from the contributions paid through F24, 9 employees counted from the Certificazioni Uniche (the annual income statements issued to employees), the cross-check between F24, CU and Modello 770 (the withholding tax return), and revenue per employee against the sector median. Why it matters: you know how much staff weigh on revenue and whether the next hire is affordable.
Sample company · illustrative data
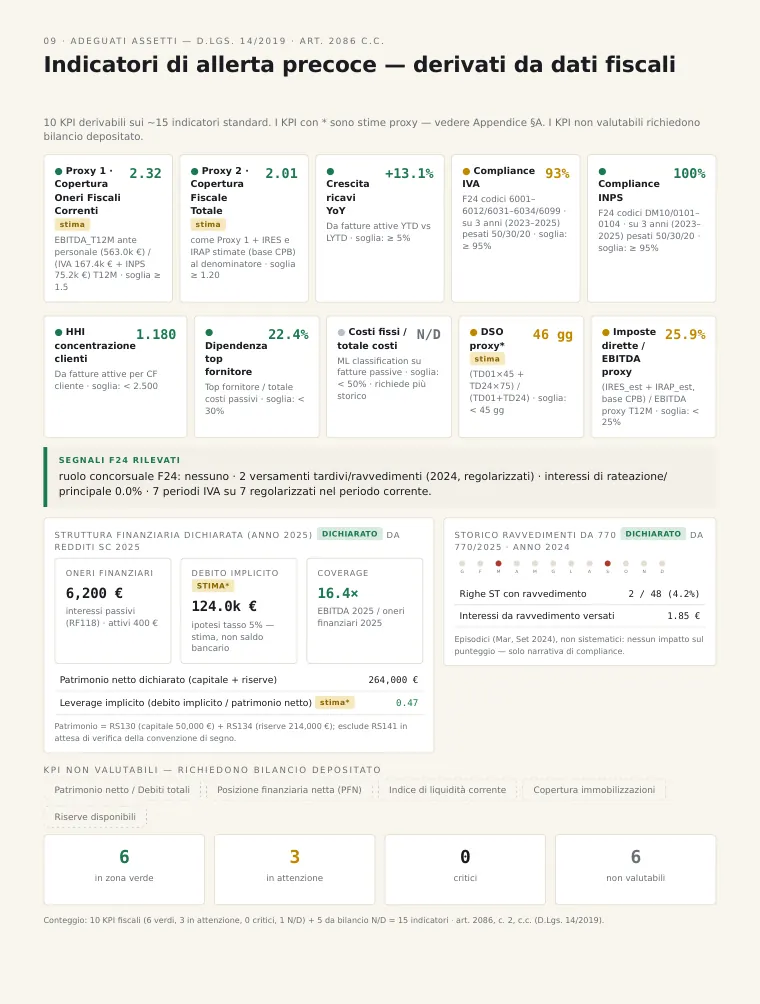
12Page 12 · Early warning indicators
What it shows: ten indicators read from the tax data, each with its threshold and colour, the F24 signals such as voluntary corrections and instalment plans, and the financial structure from the income tax return: financial charges, equity and leverage. Why it matters: under Italian law, whoever runs the company must notice signs of trouble in time. Archived every month, this page documents that someone was keeping an eye on them.
Sample company · illustrative data
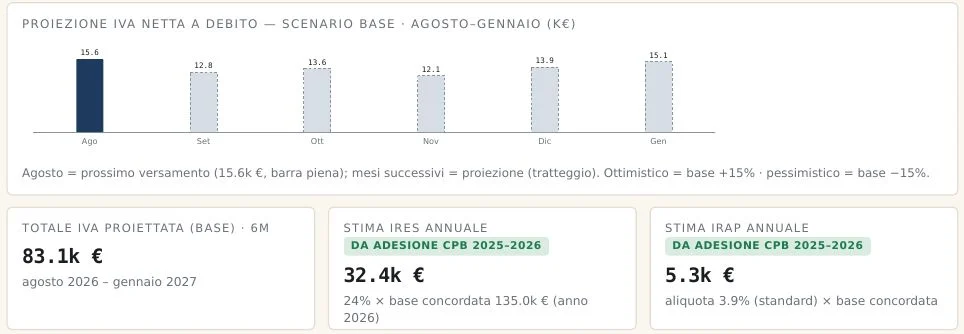
13Page 13 · VAT and taxes
What it shows: the next VAT payment, €15.6k on 16 August, the six-month projection of €83.1k, the VAT declared in the LIPE (the quarterly VAT returns), the arrears from the annual VAT return already fully recovered, and IRES (corporate income tax) and IRAP (regional tax) calculated on the agreed income. Why it matters: you know in advance how much will be due, and which document each number comes from.
Sample company · illustrative data
14Page 14 · Tax and commitments
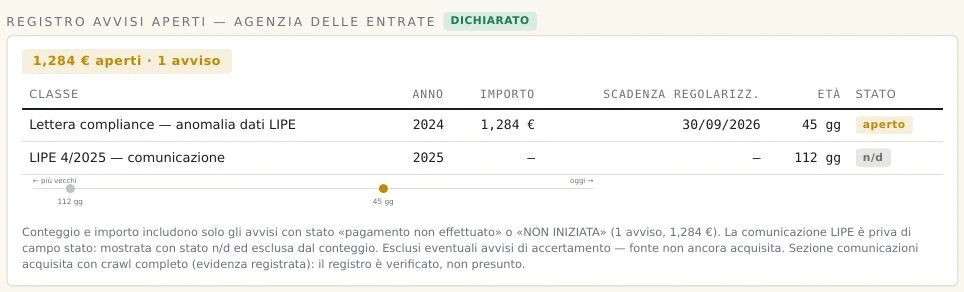
What it shows: every mandatory payment in order of due date, with an F24 VAT payment of €15,620, contributions of €5,500 and an IRES instalment of €19,440 in November, recurring commitments, and the register of open notices, with a €1,284 compliance letter to settle by 30/09/2026. Why it matters: you know every mandatory payment before it arrives, with amount and date.
Rendiconto prospettico — proiezioni a 12 mesi
Sample company · illustrative data
15Page 15 · Forward statement
What it shows: revenue for the next twelve months, €1,265.0k, estimated margin and cash flow, with +€114.0k cumulative, and a summary by quarter. The projection uses a three-month moving average and the linear trend; the seasonal profile of past revenue is shown beside it for reference only. Why it matters: you plan the year on a projection built from the company’s real data.
Sample company · illustrative data
16Page 16 · Capacity to invest
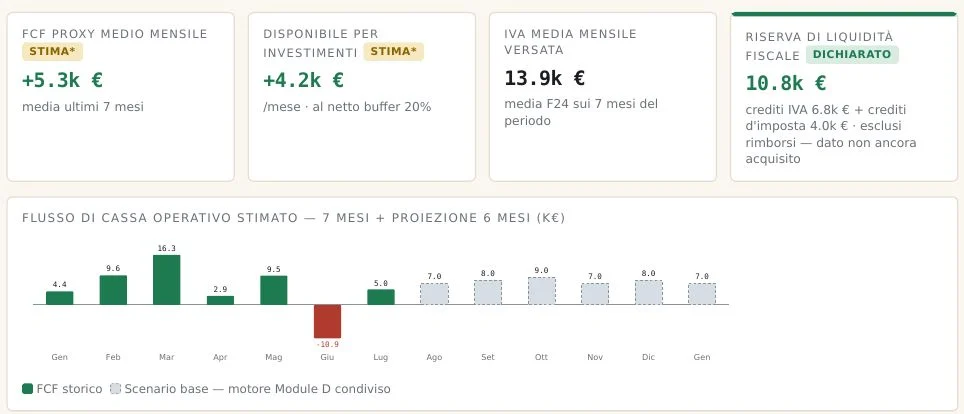
What it shows: average self-financing of +€5.3k a month, how much remains to invest, the fiscal liquidity reserve of €10.8k in credits, the best months for a purchase and a simulation of the VAT on an investment of €50k, €100k or €200k. Why it matters: you decide on a purchase knowing whether cash holds up, and when it makes sense.
Metodologia, limitazioni e disclaimer
Sample company · illustrative data
17Page 17 · Methodology appendix
What it shows: how each estimate is calculated, the sources and their reliability, what the report does not measure, the score weights, and revenue declared in the LIPE against revenue calculated from invoices: −0.30% in the first quarter, +0.20% in the second. Why it matters: every number says where it comes from, and you can check it.
05Page 5 · Customers and suppliers
What it shows: the top six customers and suppliers with their share, concentration, the 18 of 23 customers retained from the year before, and the revenue bridge: €663.0k + €176.0k from new customers − €76.0k from lost customers − €13.0k from stable customers = €750.0k. Why it matters: you see whether growth comes from new customers or from the ones you already have.
09Page 9 · Recurring revenue and stress test
What it shows: consolidated recurring revenue, €730.0k or 61.6% of the twelve months, emerging and occasional revenue, and three scenarios: if the main recurring customer leaves, €1,050.0k of revenue remains, 11.4% less. Why it matters: you know how much revenue holds even in the worst case.
Beyond the PDF
Every month you also receive what a PDF cannot show
With the report comes the monthly verdict by email: how much to set aside by the 16th, when Italian taxes fall due, and three things to do. Between reports, an email reaches you each time the Agenzia writes to the company, with the Italian original attached and the amount and settlement date explained in English.
FiscalPulse
Compliance letter, quarterly VAT data mismatch 2024, €1,284, settle by 30/09/2026
Sample company · illustrative data
Questions
Is the data in the sample report real?
It is illustrative data: the company, customers, suppliers and numbers are fictional, built to show the complete report. The pages, the calculations and the automated quality check are the same ones FiscalPulse applies every month to companies that activate the service with their own Cassetto Fiscale.
Will our company’s report have the same pages?
Yes, the same seventeen-page structure. Some items depend on the company: the ISA index applies only below €5.16 million in revenue, agreed income only to companies that joined the two-year agreement, and the analyses of customers and recurring revenue grow with the company’s invoice history.
How often does the report arrive?
Every month, in two versions: provisional on the 3rd and final on the 18th, which stays archived exactly as it was generated. You also receive an email each time the Agenzia writes to the company, with the original letter attached and the amount and deadline explained in English.
Can we show the report to an Italian bank?
Yes. Every month there is a version to present to Italian banks, confidi (credit guarantee consortia) and leasing companies, with the tax score across six dimensions and published weights. It is an analytical tool based on declared tax data, and it accompanies the documents the bank asks for.
Why are some numbers in the report marked as estimates?
Because the report always states where each number comes from: declared to the State, read from the F24 payments, observed in the data or estimated. Where a declared figure exists it replaces the estimate. Where an estimate remains, it is marked as such and the formula is explained in the appendix.
Your report will look like this, with your Italian company’s numbers.
Activation needs the company’s Entratel or Fisconline credentials and takes about half an hour.