
How we read the numbers
How precise is an estimate? It depends on the company, and the report measures it company by company.
Where a figure has been declared to the Italian State, the report uses it. Where an estimate is needed, it marks it as one. When the declared figure arrives, it measures how far the estimate was off, period by period.
Declared vs calculated delta
−0.30% · +0.20%
Sample company · illustrative data
Five levels of certainty, and every figure says which one it is on
Not every figure in a report has the same origin. Some are declared to the State, such as the VAT due in the periodic VAT return. Others are measured, meaning read directly from a document such as an invoice, or reconstructed from actual payments, such as payroll cost. Others again are estimated on stated assumptions, and some do not apply to that legal form.
Read more
The report applies the same order of precedence to every value: first the declared figure, then the income agreed with the Agenzia delle Entrate (the Italian Revenue Agency) under the concordato preventivo biennale (CPB, a two-year advance agreement on taxable income), then the reconstructed figure, and last the estimate. The most certain available source always wins, and every figure carries its tag, for example “declared · from REDDITI 2025” (the income tax return), “from F24” (the single form for Italian taxes and contributions) or “estimate”.
The gap, measured quarter by quarter
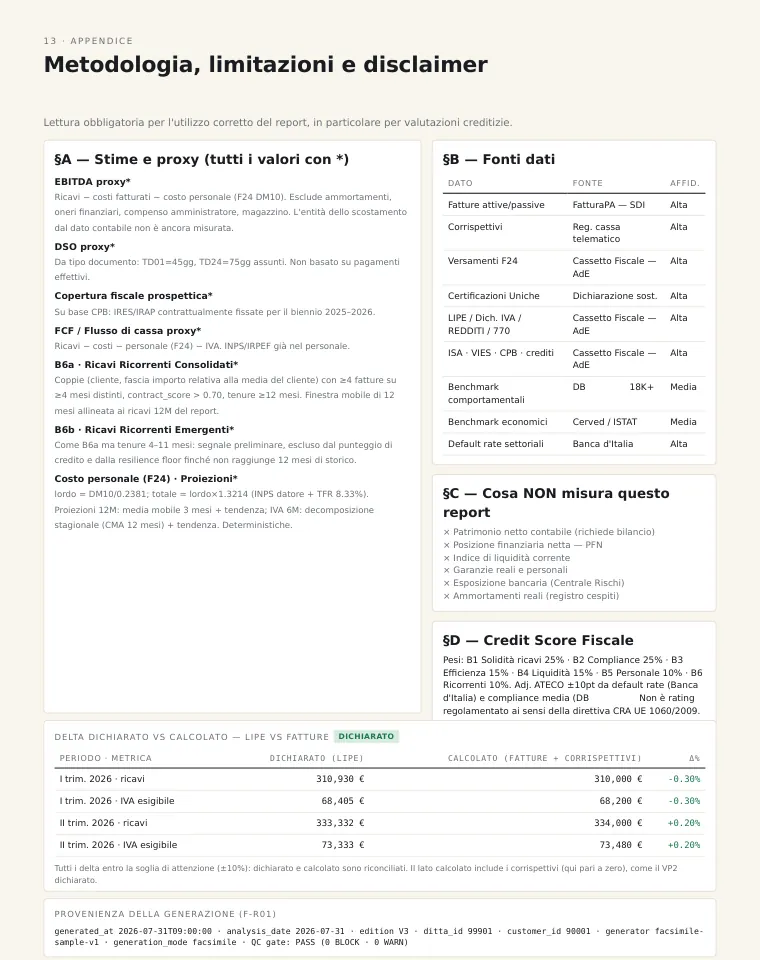
The revenue the report calculates each month from invoices and electronic retail takings can be compared with the revenue the company itself declares in its periodic VAT return, the LIPE. In the sample company, for the first quarter of 2026 the declared figure is €310,930 and the calculated one €310,000, a gap of 0.30%. In the second quarter the declared figure is €333,332 and the calculated one €334,000, a gap of 0.20%. The same applies to output VAT.
Read more
The comparison is repeated for every company and every period, as soon as the return is available. The precision you read is that company’s, in that quarter.
Sample company · illustrative data
Revenue Q1 2026 · declared in LIPE €310,930 · calculated €310,000 · −0.30% · Q2 · €333,332 against €334,000 · +0.20% · attention threshold ±10%
Projections state their margin
A projection is still an estimate, and the report presents it that way. The next VAT payment, €15,600 by 16 August, carries the “estimate” tag, with the declared return that anchors it shown below. Months already paid are solid bars, projected months dashed bars, with an optimistic and a pessimistic scenario 15% above and below the base.
Read more
For revenue over the next twelve months, the report shows €1,265,000 with a 90% confidence interval of plus or minus €96,000. Projections are deterministic: revenue is projected with a moving average and a linear trend on actual data, and VAT also takes seasonality into account. No generative model is involved.
Projected net VAT payable, base scenario
Projected 12-month revenue, 90% CI
Sample company · illustrative data
Next VAT payment €15.6k (estimate) · VAT projected over six months €83.1k, ±15% scenarios · revenue projected over 12 months €1,265.0k, 90% CI ±€96k
To decide, you need the sign and the direction, month by month
Financial statement figures arrive twelve to eighteen months after the events. Tax data arrives within thirty days and already says whether things are going up or down, and by how much. When you are deciding whether to set money aside, chase a customer or postpone an investment, knowing this in time is what counts.
Read more
When the financial statements become available, every measure in the report is compared with the matching line item. The gap becomes a quality measure per metric and per sector, and the judgement thresholds are recalibrated on the real population of companies.
A missing figure stays empty
When a document is missing or the history is too short, the report does not fill the gap with a zero. It writes “not available” with the reason, and that measure leaves the averages and scores so it cannot move them by mistake.
Read more
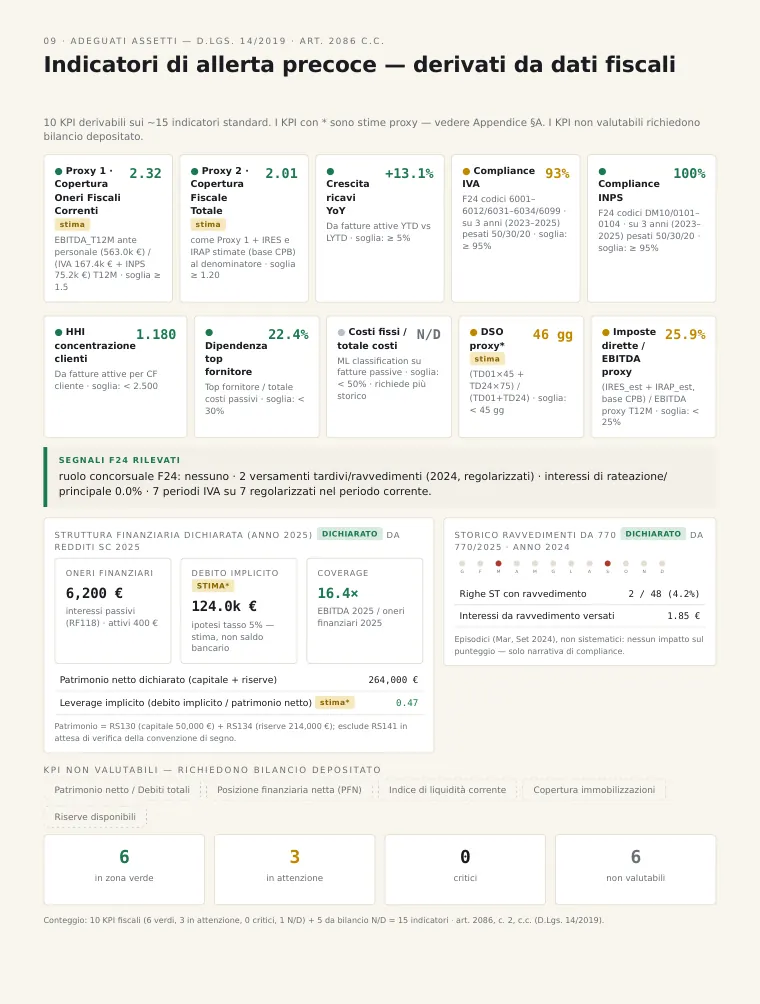
In the example, the share of fixed costs in total costs shows as not available because it needs more history, and five indicators that depend on filed financial statements are listed separately as not assessable.
Sample company · illustrative data
Fixed costs / total costs: N/A, needs more history · 5 indicators from financial statements: not assessable
On the report page
The gap table, in the appendix of every report
At the end of every report, the “Declared vs calculated delta” table puts, for each quarter, the figure declared in the VAT return next to the one calculated from invoices and electronic takings, with the gap as a percentage.
Read more
Above it, the appendix explains every estimate marked with an asterisk and the formula used to calculate it.
Every estimate states its gap. To decide, you need the sign and the direction, month by month.
Sample company · illustrative data
Questions
What is the difference between a declared figure and an estimated one?
A declared figure is one the company has reported to the State, for example in a VAT return or the income tax return. An estimated figure is calculated on explicit assumptions. The report uses the declared figure whenever it exists and marks every estimate with an asterisk and its formula.
How far does the revenue estimate differ from the declared figure?
In the sample company the gap is 0.30% in the first quarter of 2026 and 0.20% in the second, both within the 10% attention threshold. The gap compares revenue calculated from invoices and takings with revenue declared in the LIPE. It varies from company to company, and the report measures it every quarter.
Why use estimates if the financial statements will arrive later?
Because financial statements arrive twelve to eighteen months after the events, when many decisions have already been taken. Tax data arrives within thirty days and shows the direction. When the financial statements become available, the report compares every measure with the matching line item and measures the gap.
Do the report’s projections use artificial intelligence?
No, the projections are deterministic: moving average and linear trend calculated on actual payments and invoices, with seasonality for VAT, and no generative models. Machine learning comes in earlier, when documents are read, for example to classify invoices, and only where it adds precision. Every projection carries the estimate tag.
What happens if a document is missing or the history is too short?
The measure shows as not available, with the reason written next to it, and leaves averages and scores. The report never turns a missing figure into a zero, and a line such as “no notices” appears only when the reading of the Cassetto Fiscale, the company’s tax drawer at the Agenzia, is complete.
If you would like to see the gap measured on your own company’s figures, you will find it in the appendix from the first report.